Query History Examples
On this page
Trace and Record Expensive Queries
The Query History feature can also be used to capture queries that take longer to run than expected.
-
Set the events queue size,
trace_, to 1,600,000 bytes.events_ queue_ size SET GLOBAL trace_events_queue_size = 1600000; -
Enable the
Query_event type to look for queries that take over a second to run.completion CREATE EVENT TRACE Query_completion WITH (Query_text = on, Duration_threshold_ms = 1000); -
View the Query History dashboard.
After a few minutes, those queries that take over a second to run will be displayed, from the most time-intensive to the least. 
-
Let the collection of queries run for a few hours, ideally during a peak usage period.
Doing so will reveal expensive queries in the Query History dashboard that can then be analyzed and optimized with query optimization tools such as Visual Explain. Refer to the View and Optimize a Workload in Real-Time section below for an example of how to optimize expensive queries.
Resolve an Unexpected Slowdown
For the sake of illustration, imagine that the cluster monitoring dashboards revealed an uncharacteristic system slowdown that occurred during a specific period, where the CPU and memory utilization spiked significantly.
-
Set the events queue size,
trace_, to 1,600,000 bytes.events_ queue_ size SET GLOBAL trace_events_queue_size = 1600000; -
Enable the
Query_event type to look for queries that take over a second to run.completion CREATE EVENT TRACE Query_completion WITH (Query_text = on, Duration_threshold_ms = 1000); -
To see if there are any queries that require immediate attention, view the Query History dashboard.
After a few minutes, those queries that take over a second to run will be displayed, from the most time-intensive to the least.
-
Select one of these queries and profile the query in Visual Explain.
Visual Explain will provide suggestions for optimizing each query. Repeat this process for all queries that take over a second to run. -
Let the collection of queries run for a few hours, ideally during a peak usage period.
Then, view the cluster monitoring dashboards to see if this system slowdown reoccurred. If it had, review the Query History dashboard to determine if any long-running queries were the cause, or were at least a contributing factor. If long-running queries are present, Visual Explain can be used to optimize them. Refer to the View and Optimize a Workload in Real-Time section below for an example of how to optimize expensive queries.
View Query Runtimes Over Time
Filtering by a specific activity_, which is a common identifier of similar query shapes, can be used to better understand the distribution or change of a query’s runtime over multiple time periods, or when different parameters are used in a query.
-
Set the events queue size,
trace_, to 1,600,000 bytes.events_ queue_ size SET GLOBAL trace_events_queue_size = 1600000; -
Enable the
Query_event type to look for queries that take over 5 milliseconds to run.completion CREATE EVENT TRACE Query_completion WITH (Query_text = on, Duration_threshold_ms = 5); -
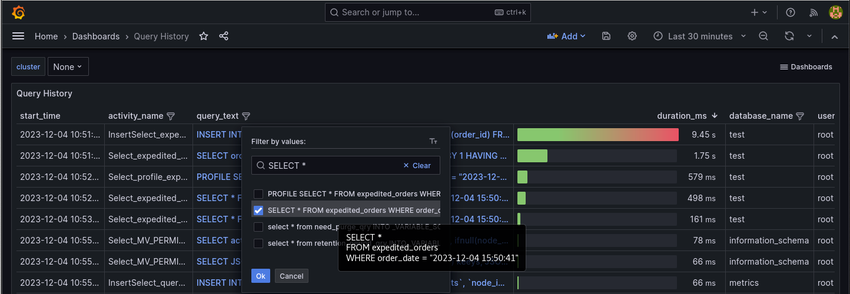
View the Query History dashboard and filter by
activity_.name In this example, the activity name is InsertSelect_which corresponds to theexpedited_ orders… INSERT INTO expedited_SQL statement in the following View and Optimize a Workload in Real-Time example.orders 
The results that are displayed reflect this query’s runtime over different time periods.

View and Optimize a Workload in Real-Time
In this example, a table will be created that contains a million rows.
While it’s suspected that adding an index on a column will increase this query’s performance, this hypothesis can be confirmed via the use of the Query History and Visual Explain features of SingleStore.
Create the Dataset
-
In a SQL client, create the following rowstore table in the database of your choice (such as a test database) and fill it with mock order data.
CREATE ROWSTORE TABLE if not exists expedited_orders(order_id int,order_date datetime,key(order_id),shard(order_id));INSERT INTO expedited_orders VALUES(1, now()); -
Re-run the following SQL statement until 1,048,576 rows of data have been inserted into the table.
INSERT INTO expedited_ordersSELECT order_id+(SELECT max(order_id) FROM expedited_orders), now()FROM expedited_orders;
Obtain an Order Date
-
In a SQL client, run the following query to obtain a sample
order_.date SELECT order_date, count(*)FROM expedited_ordersGROUP BY 1HAVING count(*) = 1; -
Run the following query using an
order_from the previous query result.date Note: The remainder of these steps will use
2023-12-04 15:50:41for theorder_.date Use an order_from your own database to ensure that this example will work.date SELECT * FROM expedited_orders WHERE order_date = "2023-12-04 15:50:41";
View Query Performance
-
Set the events queue size,
trace_, to 1,600,000 bytes.events_ queue_ size SET GLOBAL trace_events_queue_size = 1600000; -
Enable the
Query_event type to look for queries that take over 250 milliseconds to run.completion CREATE EVENT TRACE Query_completion WITH (Query_text = on, Duration_threshold_ms = 250); -
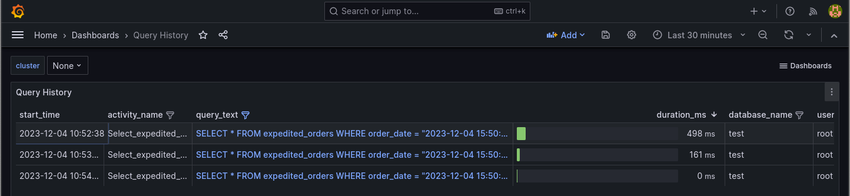
View the Query History dashboard.
After a few minutes, those queries that take over a second to run will be displayed, from the most time-intensive to the least.
Of the queries displayed, the
SELECT * FROM expedited_is the example query to optimize as it required nearly 500 milliseconds to complete.orders WHERE order_ date = "2023-12-04 15:50:41";
Visualize and Optimize the Query
-
In a SQL client, run the following
PROFILE-related queries to obtain the JSON output.PROFILE SELECT * FROM expedited_orders WHERE order_date = "2023-12-04 15:50:41";SHOW PROFILE JSON; -
In Visual Explain, click the Paste JSON button, paste the JSON output into the provided field, and click the Show Explain button.
Visualizing this query reveals that SingleStore performed a full table scan (indicated by TableScan) in this query.
As a consequence, each row was scanned to determine which order matched the desired order_.date Note that the execution time for this query is 579 milliseconds, which includes the query compilation time.

To determine if adding an index will improve performance:
-
In a SQL client, add an index on the
order_column.date CREATE INDEX date_index ON expedited_orders (order_date); -
Re-run the
SELECT * FROM expedited_query.orders SELECT * FROM expedited_orders WHERE order_date = "2023-12-04 15:50:41"; -
Re-run the
PROFILE-related queries to obtain the JSON output.PROFILE SELECT * FROM expedited_orders WHERE order_date = "2023-12-04 15:50:41";SHOW PROFILE JSON; -
Copy the JSON output to the clipboard.
-
In Visual Explain, click the vertical dots menu in the upper right-hand corner, click the Paste JSON Explain/Profile option, paste the JSON output into the provided field, and click the Show Explain button.
Visualizing this query reveals that SingleStore used an index range scan (indicated by IndexRangeScan) instead of a full table scan, thereby limiting the scan to only those rows that should contain the specified
order_.date Note that the execution time for this query is down to 54 milliseconds, which also includes the query compilation time.

To see how quickly this query will run without the query compilation time:
-
In a SQL client, re-run the
SELECT * FROM expedited_query.orders SELECT * FROM expedited_orders WHERE order_date = "2023-12-04 15:50:41"; -
Re-run the
PROFILE-related queries to obtain the JSON output.PROFILE SELECT * FROM expedited_orders WHERE order_date = "2023-12-04 15:50:41";SHOW PROFILE JSON; -
Copy the JSON output to the clipboard.
-
In Visual Explain, click the vertical dots menu in the upper right-hand corner, click the Paste JSON Explain/Profile option, paste the JSON output into the provided field, and click the Show Explain button.
Visualizing this query reveals that the execution time has been reduced to 4 milliseconds.

Review Query Performance
View the Query History dashboard.SELECT * FROM expedited_ query.
The query’s performance history is displayed.
Note that the query duration in Query History and the query execution time in Visual Explain will differ slightly due to how the query duration is measured.
Summary
By employing both the Query History and Visual Explain features to locate and optimize the query in this example, the runtime for the SELECT * FROM expedited_ query has been reduced:
-
From an initial 597 milliseconds for a full table scan
-
To 54 milliseconds after introducing an index, which includes the query compilation time
-
To only 4 milliseconds after the query had been compiled
For additional examples of using Visual Explain, refer to SingleStore Visual Explain and the final lab in the SingleStore Query Tuning training course.
Related Resources
-
Information Schema
-
SQL Functions
Last modified: February 2, 2024